


2024 power generation in the UK

Introduction
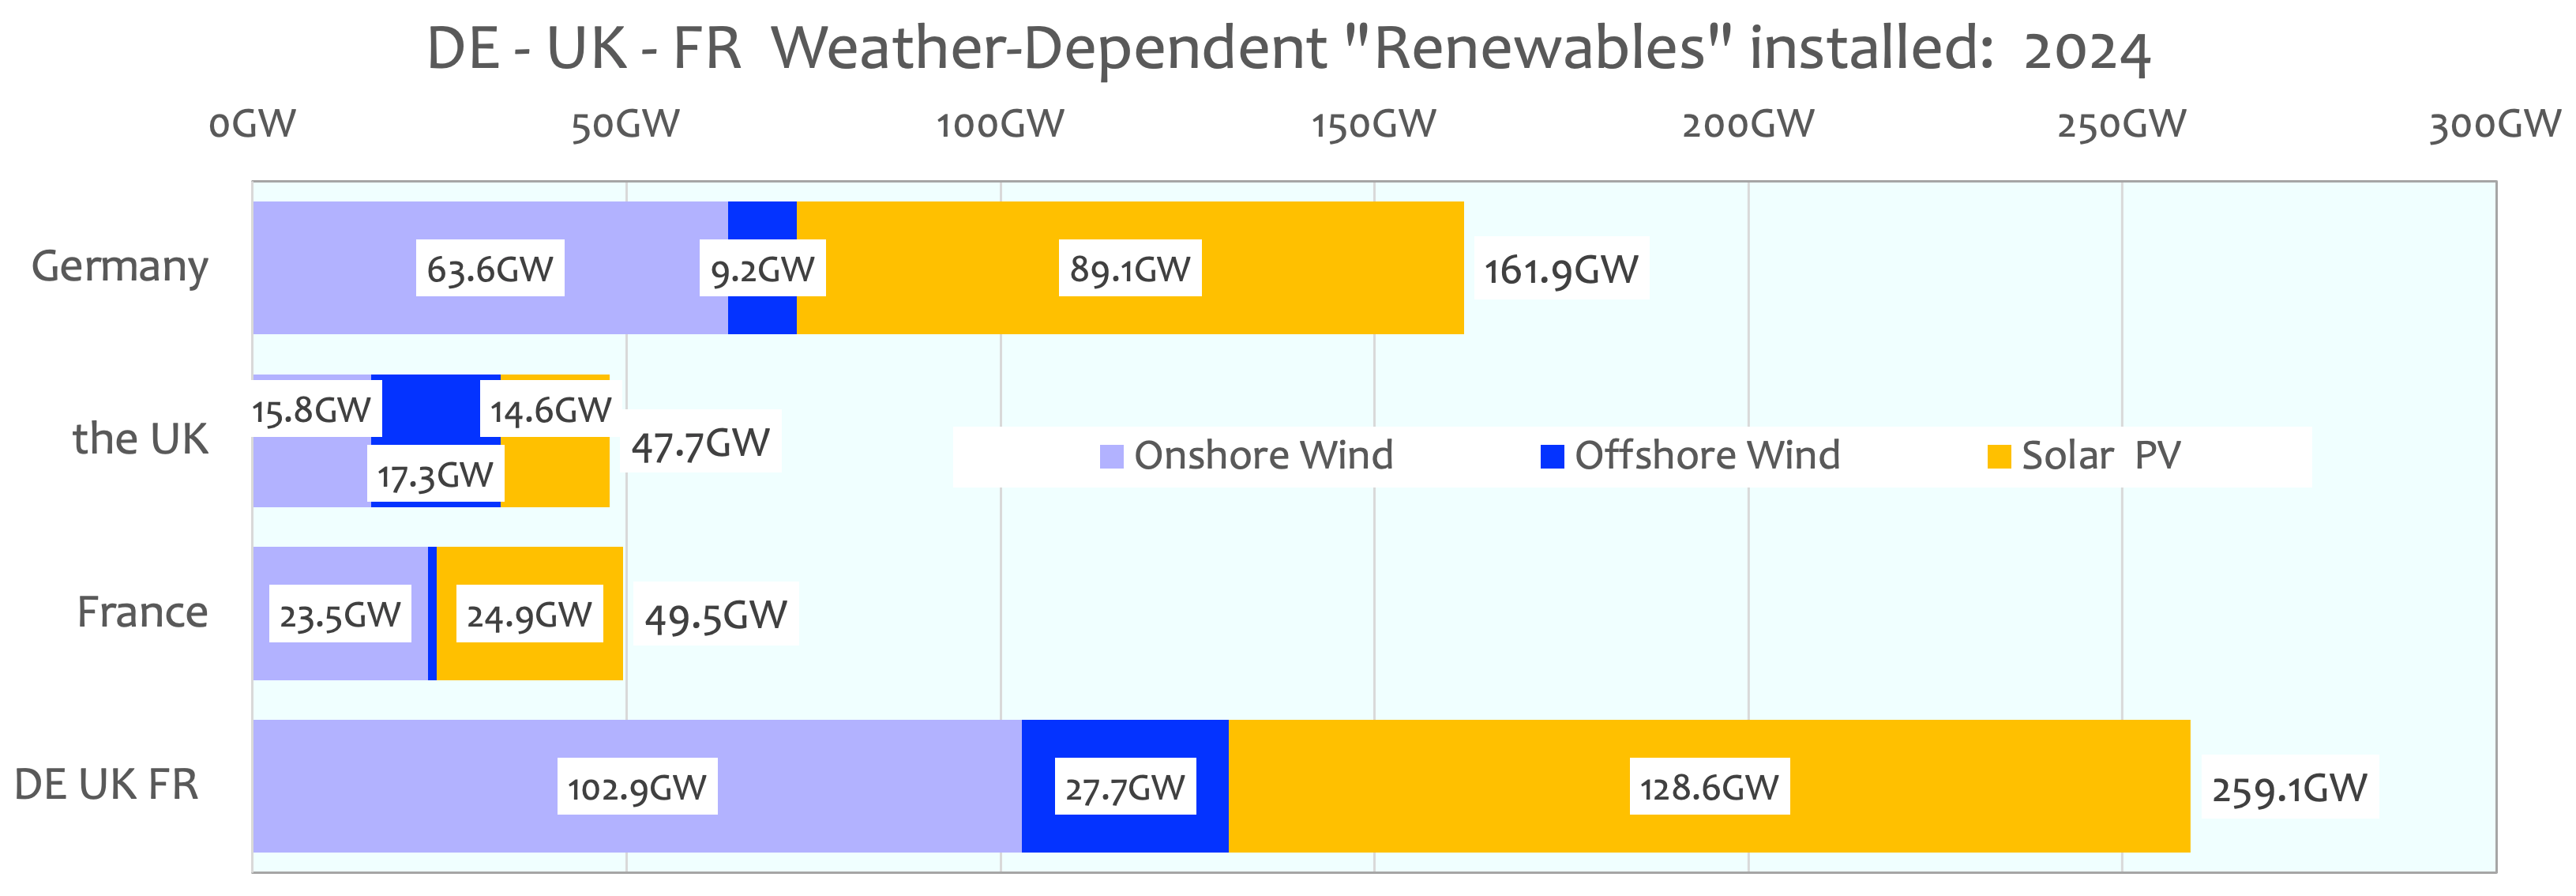
Germany, the United Kingdom and France account for close to half of all European Weather-Dependent “Renewables”.
These illustrations show the hourly power production by all UK generation technologies in 2024. Each Nation exhibits their different approaches to power production.
Note that: the hourly output figures are as accurate as the basic Gridwatch data and Installation values for the UK are taken from the recently updated values from ref.org
The United Kingdom power generation illustrated: 2024
The Gridwatch UK data had a major deficiency from 1/6/2024 to 10/7/2024: accordingly a batch of data was substituted from later in July that year. The cause of this interruption arose because of the illness of the Gridwatch Templar author: I trust he is well recovered, his contribution and website are invaluable. This substitution does not materially affect any cumulative results shown here.

UK Weather-Dependent “Renewables” 2024

Productivity matters
The installation of Weather-Dependent “Renewables” is an attempt to substitute conventional power generators, (Nuclear, Gas or Coal, achieving consistent productivity in the region of ~90%), with “Renewables”, Solar and Wind power with the variable hourly / annual productivity levels close to 20% as shown below and then to assert that because the fuel, the Wind and the Sun, is free that these power generators must be cheaper than conventional generators and thus capable off reducing a Nation’s electrical energy costs.
Simply comparing the combined “Renewables” productivity in the region of 25% – 18% with conventional power productivity in the region of 90%.
In other simple words at least ~5 times or more power generation equipment are needed to provide the comparable annual power contribution as produced by conventional generators: but that “Renewable”power output is intermittent, unreliable and incapable of dispatch to meet demand.

The mix of “Renewables” installed by a Nation will determine the profile of their actual annual productivity.
Just comparing the capital and running costs ignores the additional costs imposed by the use of “Renewables” to cover:
the essential dispatchable back-up generators when the “Renewables” are marginally productive.
the extended power grid needed too accept power from more remote “Renewables” installations.
the payment for renewables when they under or even over produce.
these distorting policy interventions adding to consumer costs do not include:
subsidies
tax breaks / capital allowances
preferential tariffs
contracts for difference
renewable obligations
feed-in tariffs
capital allowances
arbitrary Carbon taxation
and the inevitable Renewable Energy ancillary costs caused by:
intermittency
unreliability
variability.
Summary UK power generation
The illustrations of UK power generation in 2024 shown above, indicate:
in 2024 nominally ~48GW of installed Weather-Dependent “Renewables” contributed the equivalent of ~9GW to the UK grid over the year.
the imposition of an additional of Weather-Dependent “Renewables” with a face plate generation value of ~48GW has reduced the overall UK power fleet productivity, (normally ~90%), down to ~39.5%.
in 2024 UK Weather-Dependent “Renewables” achieved a combined productivity of ~18.4%, a relatively low annual value.
in 2024 Offshore UK wind power, which is normally quite productive, only achieved a low level of productivity at 23.5%.
the unreliability and intermittency of both Onshore and Offshore Wind power is clear from the hourly graphics above.
Wind power output can vary from close to full name plate power on some occasions down to virtually nil power output: the loss of power output can occur quite suddenly over a period of just a few hours.
the UK is heavily dependent on imported power, largely from France, the Netherlands and Norway, amounting to ~15% of power contribution over the year: the UK only exports power on rare occasions.
UK energy security is at risk by having to rely on imported power:
Norway is already considering curtailing its exports to the UK and retaining its power output for its own domestic use.
France has threatened its supply to the UK in a dispute over the Channel Islands.
the level of imported power closely matched the entire output of the UK’s current indigenous Nuclear power generation.
the final closure of the last UK Coal-fired power station occurred in 2024, it contributed less than 1% of annual power demand in its year of closure.
the installation of ~48GW, Weather-Dependent “Renewables”, (~65% of the present UK generation fleet), also produced a similar (~30% cumulative power output) as Gas-firing but that “Renewable” power output was intermittent and non-dispatchable on demand.
combined UK Weather-Dependent “Renewables” achieved a combined productivity of only ~18.4% in 2024.
imported Biomass, largely imported from the USA, with CO2 emissions almost 4 times that of direct Gas-firing, contributed a dispatchable ~7% of UK demand.
irrationally the use of imported Biomass effectively negated all and any CO2 emissions savings that would have been made by other UK Weather-Dependent “Renewables”.
with a installation of ~10GW+ Gas-firing generated about 30% of all UK power at a productivity of ~87%: this power output was flexibly dispatchable, available to meet demand.
Gas-firing, but not using indigenous UK gas resources by policy, was largely able to compensate for the intermittency and unreliability of the large scale imposition of Weather-Dependent “Renewables” already installed in the UK.
Solar power is inevitably diurnal and very variable Summer to Winter: ~8 times better in the summer.
Solar power has a consistently low annual productivity of only ~10%.
Solar power is very dependent on cloudiness. The UK is one of the cloudiest nations in Europe.
Solar power contributed most power at periods of low demand, daytime during the summer and very little during the winter, especially winter evenings, the period of highest demand.
the daily timing of the contribution from Solar power does not meet the highest power demand period in winter evenings.
although capital installation costs of Solar power are comparable to Gas-firing for nameplate capital costs, Solar power output actually costs ~10 times as much as Gas-firing to install and maintain when its low productivity and its inappropriate timing of power production further increases its inutility.
Using US comparative cost data as a yardstick, the estimated long-term excess costs of the current commitment to United Kingdom Weather-Dependent “Renewables” are:
excess cost over Gas-firing: ~384 $bn; this gives an indicative value of banning Fracking in the UK.
excess cost over Nuclear power: ~257 $bn.
excess cost over Coal-firing: ~341 $bn.
Apparently this situation is so obvious that Ed Miliband cannot see it. However, UK consumers and industry can feel it and it hurts. All pain and no gain.
Altruism dies when it costs. Currently in the UK it costs plenty.